Showing posts with label CFA. Show all posts

Wednesday, August 26, 2009

CFA study session #5: economics: macroeconomics (market structure)


Accepting that our resources are limited (aka factors of production: land, labor, capital, and entrepreneurship), the fundamental economic questions become: (1) what do we produce, (2) how do we produce it, and (3) how do we distribute it. Market theory, as originally developed by Adam Smith (student at Balliol College, Oxford) in his book the "Wealth of Nations (published 1776)," posits that the independent market forces of supply and demand provide the most efficient answers to these questions. That which should be produced is that for which people are willing to pay for. The method in which it should be produced is that method by which the lowest price to the consumer, and highest profit to the producer can be achieved. Further, such a product should be distributed to the highest bidder; those most willing to pay for it.

Adam Smith, however, presupposes that all such markets for goods and services exist in an ideal state, one in which there are many buyers and sellers, no barriers to entry, perfect information, and equal and undifferentiated products where the seller is a "price-taker." This may be true in some markets, such as when you buy a loaf of bread at the supermarket, but definitely not so when you are searching for competitors to upgrade your computer's Operating System. Macroeconomics investigates this range of different markets that actually exist:

Perfect Competition --> Monopolistic Competition
--> Oligopoly --> Monopoly

As we move from left to right the producer/seller gains the upper-hand. They often enjoy large market share, barriers to entry from competitors, and a differentiated product (quality, price, and marketing) that allows the firm to "price discriminate." Many countries, including the US, are unsure about the role of monopolies. Those that have enacted Anti-Trust legislation feel that monopolies stifle innovation and suffocate new companies from emerging. Economics worry that monopolies fail to satisfy consumer demand by producing at level below equilibrium so that they can maximize profits. Others argue that this is not the case. They think monopolies offer a superior product at a lower price than consumers would otherwise enjoy. some monopolies, such as Microsoft, are quite nimble, and their size affords them the ability to spend more money on R&D leading to greater discoveries. Before we can judge which structure is best for which market we need a way to categorize each industry.

The two methods used to determine which market structure a particular industry belongs to are the "Four-Firm Concentration Ratio" and the "Herfindahl-Hirschman Index (HHI)." Both are relatively easy to calculate. In the Four-Firm approach you simply calculate the percent of market share (by sales) controlled by the four largest firms in that industry. The range spans from 0% for perfect competition to 100% for a monopoly. Anything above 60% is considered an oligopoly.


For example, if we look up ExxonMobil (XOM) stock on Yahoo!Finance we can click on "Industry," and then "Industry Summary," and discover that ExxonMobil is in the "Major Integrated Oil & Gas" industry. We can also see that the top four companies by market capitalization are: ExxonMobil ($340B), PetroChina ($214B), Royal Dutch Shell ($165B), and British Petroleum ($160B). In total, the top four companies have a market capitalization of $879B. Meanwhile, the entire industry's market capitalization is $1,305B. Therefore, the Four-Firm ratio is 67.3% ($879B / $1,305B), and the "Major Integrated Oil & Gas" industry is considered an Oligopoly.

We use the Herfindahl-Hirschman Index when we require even greater specificity. The HHI adds the square of the percentage of market share of the top 50 firms in the industry (or all the firms if less than 50). To use a different example, if there are only four firms in an industry, and their market share (by sales) are: 50%, 25%, 15%, and 10% then we would use the formula:

HHI = 502 + 252 + 152 + 102 = 3,450 (Oligopoly)
Where the range is:
1 (perfect competition) --> 1,000 (monopolistic competition) --> 1,800 (oligopoly) --> 10,000 (monopoly)

***It should be disclosed that I used market capitalization to calculate both the Four-Firm ratio and Herfindahl-Hirschman Index as a proxy for market share by sales since I believe that there exists a high correlation between the two statistics, and because market capitalization data is more readily available.***

The following graphs are very useful in visually understanding the four types of market structures. The one thing they all have in common is that the equilibrium point is always found by first locating the intersection of Marginal Cost (MC) and Marginal Revenue (MR). In other words, firms always want to produce up until the point where manufacturing just one more unit no longer has any economic benefit, because the cost of producing that one additional unit outweighs the revenue generated. This will determine the equilibrium price and quantity.

Once we have found this point, we can find the equilibrium price by drawing an imaginary vertical line up to where it intersects with the Demand Curve (DC); follow the line downward to find the equilibrium quantity. Now that we know the price and quantity of that which is to be produced, we want to find out whether we are profitable. We determine profitability by once again following the imaginary vertical line that we have drawn to where it intersects with the Average Cost (AC) curve. The space between the DC and AC determines whether or not we have a profit or loss. We experience a profit if the AC lies below the DC. When AC lies above the DC we have an economic loss, and the firm should shutdown and cease operations.
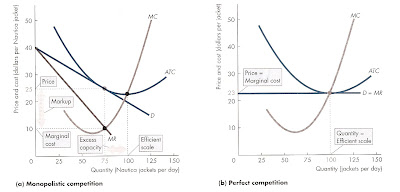
Many of the examples we have used throughout this post have been oligopolies. The biggest fear when dealing with oligopolies is "price collusion," as most famously demonstrated by the oil cartel formed by OPEC during the 1970s. One way to combat oligopolies (or at least predict their behavior) is to apply game theory. When the strategies and payoffs for each player are known, and all players must follow the same rules, we can calculate the "Nash Equilibrium" for which outcome is most likely. The equilibrium depends on the nature of the game being played as there are several possible games, including the prisoners' dilemma and chicken. We expect more collusion to exist when a game is repeated, and "bad" behavior can be penalized, resulting in greater cooperation.

Thursday, August 6, 2009

cfa study session #4: economics: elasticity

Following quantitative methods comes an entire 500 page book devoted exclusively to economics. Separated into 3 sections, the economics portion of the CFA exam focuses on microeconomics, macroeconomics, and monetary & fiscal policy. This blog post will deal specifically with the first section: microeconomics, which includes price elasticity, market theory, and the organization of production & output.

We start with understanding the "price elasticity of demand," which simply measures the responsiveness of the quantity demanded of a product relative to changes in the price for that same product. This degree of responsiveness determines how elastic the products is, that is, whether it is elastic (very responsive), inelastic (not responsive), or unit elastic (when change in demand equals change in price). The equation is:

elasticity of demand = *% change in quantity demanded / % change in price
* % change is calculated by dividing the difference between the starting and ending values by an average of the starting and ending values (rather than dividing by the beginning value, which is more common when calculating % changes) to get a more accurate elasticity ratio.

Intuitively we know that some products, such as oil, are highly inelastic. In other words, the world will always demand oil regardless of the price, as evidenced when a barrel of oil reached an all-time peak of $147.27 on July 11, 2008. In contrast, a product such as a t-shirt is very elastic. Unless it's a Ralph Lauren polo t-shirt, most people consider one t-shirt to be very similar to any other, and therefore will purchase from whichever manufacturer has the lowest price. Elasticity isn't always a foregone conclusion, and it can change over time. For example, when Apple launched the iPod they successfully differentiated their mp3 from their competitors, turning an otherwise elastic commodity into an inelastic "must-have" brand. By developing a strong brand image and brand loyalty, Apple was able to charge a premium by changing the elasticity for their iPod.

Products tend to be elastic when there a large number of substitutes available. For example, an increase in the price of hamburgers will lead to a decrease in their consumption, because hamburgers have an elastic demand curve, and an concomitant increase in consumption of hot dogs (all other things being equal), because hot dogs are consider a viable substitute for hamburgers. There is no accounting for taste! This example sets the stage for the next step in understanding elasticity, which is calculating "cross elasticity" to determine the responsiveness of demand relative to price based on more than one product, such as hamburgers and hot dogs.

Using the above example, we can calculate whether two different products are substitutes (positive cross elasticity) or compliments (negative cross elasticity). If the price of hamburgers doubles from $2 to $4 each, and this results in an increase in hot dogs consumed from 8 to 14, then we can calculate that the two products are substitutes, because resulting cross elasticity ratio is positive .817, calculated as follows:

= (8-14)/11 / (4-2)/3
= 5.45% / 6.67%
cross elasticity = .817

The higher the number, the more magnified the difference in quantity demanded in one good relative to an incremental change in price of the substitute good. And of course the same holds true working in reverse for compliment goods, such as soda and hotdogs, which we would expect to have a negative cross elasticity.

Besides measuring the elasticity of demand, and cross elasticity, we can similarly calculate "income elasticity" by dividing the % change in quantity demanded of a product by a % change in income. In other words, when we earn more money we are more likely to purchase "luxury" products (i.e. steak and lobster), which have high elasticity, and less likeley to purchase inelastic "inferior" products (i.e. potatoes and rice). In this case a negative ratio indicates an inferior good, and a positive ratio indicates a luxury good, which is highly responsive to changes in income and therefore very elastic.

Elasticity of supply operates along similar lines as it does for demand. We calculate supply elasticity by dividing the % change in quantity supplied by the % change in price. The degree of responsiveness of supply to price often depends on the number of substitutes available, and whether the time-frame for making a supply decision is momentary, short-term, or long-term in nature.

Beyond asking you to calculate elasticity, a typical question may involve understanding the effect of elasticity on demand and revenue. For example, "For a particular company's product, the % change in quantity demanded is smaller than the % change in price that caused the change in quantity demanded. If the company increased the price of that product, total revenue from sales of that product would most likely:
A. increase and demand in elastic
B. decrease and demand is elastic
C. increase and demand is inelastic

The answer is C. We must first determine whether or not the product is elastic or inelastic before we can determine its effect on quantity demanded and ultimately revenue. The question tells us that price has little effect on quantity demanded (in fact, it's smaller!). If a product is inelastic then people will continue to buy it even if the price goes up (like the price of oil). Therefore, even if the same amount of product is sold, but the price they are charging has increased, then by definition the total revenue must also increase.

Friday, July 31, 2009

CFA study session #2: quantitative methods: time-value


Now it begins; quantitative methods is worth the price of admission! I intend for these posts to be helpful to not only CFA candidates, but also to MBAs looking to brush up on their quant skills (aka poets). Before you go any further, however, you MUST invest in a financial calculator. I use the HP-12C (Hewlett Packer); it is one of only two calculators recognized by the CFA Institute (the other being the Texas Instruments BAII Plus). The majority of calculations will involve no more than 5 buttons that are nicely placed next to one another on the very top of the calculator:

n (number of time periods)
i (interest rate per period)
PV (present value)
PMT (payment for a series of cashflows)
FV (future value)
Mastering time-value questions helps to build the foundation for more difficult calculations, such as "internal rate of return (IRR)" and "net present value (NVP)," which are critical for classes in Finance and Private Equity.
The simplest of time-value questions might ask you "what $1,000 invested today in a CD for 5-years compounded annually at a rate of 3.00% would be worth at maturity?" All you need to do is type $1,000 (press "PV"), type 5 (press "n"), type 3 (press "i"), and then press "FV" and within seconds it will give you the correct answer of $1,159.27. Of course this problem could have been made more difficult by telling you that the interest compounds monthly (rather than annually), but this only requires the slightest of adjustments (i.e. adjust the number of periods for "n" from 5 to 60 (5x12 months) and for "i" from 3.00% to 0.25% (3/12 months).
They can also ask you the question in reverse by requiring you to choose between two payment options by calculating PV. For example, say "you won the lottery and your two options are to either receive a lump sum of $1,000,000 today, or receive $2,000,000 at the end of 10 years with a interest rate of 4.00% compounded annually over that period. Which is the better option?" Begin by figuring out the PV of the future lump sum by typing 10 (press "n"), type 4 (press "i"), and type $2,000,000 (press "FV"). Then press PV and you will discover that it is worth $1,351,128.24 in today's dollars, and therefore the better option. Of course, good luck, postponing your purchase of a Ferrari for 10 years! With practice you an easily master time-value questions. After all, I majored in Political Science (minor in Philosophy) in college and now look at me crunch out these numbers!
You can also solve for the number of periods ("n"), or interest rate ("i"), provided you are given the PV and FV, as well as a third variable. For example, you may be asked the question: "What is the yield to maturity (YTM) on a corporate bond that was bought for $980 and pays a semi-annual 5.00% dividend, which will mature in 10 years at a face value of $1,000?" To solve: type 20 (press "n" 10 year bond x 2 annual dividend payments), type -$980 (press "PV" negative sign to signify outflow), type $1,000 (press "FV positive sign to signify inflow), type $25 (press "PMT" signifies semi-annual 5% dividend inflow based on $1,000 par value). Once you've input these 4 variables, press "i" and after about 10 seconds (btw this is a harder calculation) the calculator will tell you that the answer is 2.63%, which you must then multiple by 2 to get the annual rate (after all, we were working with semi-annual payments), giving you a final YTM answer of 5.26%. Predictably, the YTM is greater than the 5.00% dividend rate, because the bond was bought at a $20 discount ($1,000 - $980), which must be included into the overall investment return. In contrast, if the bond was bought at a premium to face value, say $1,020, then the YTM would have been lower than the dividend rate. One last point, to avoid future aggravation for why your HP-12C is not processing properly, you MUST follow the convention of using the negative sign to signify cash outflows (money-out), and the positive sign to signify cash inflows (money-in). Otherwise, in the previous example, you would have seen the "ErroR" sign if you used positive signs for PV, PMT, and FV. Again, this will be critical later when accounting for cashflows when solving for "IRR" and "NPV."
Continuing with the trend of asking increasingly difficult (but solvable) questions, see if you can answer this final question: "Your oldest child is currently 22 years old and just completed their undergraduate degree, when she mentions to you, that in 6 years (after they gain some work experience) she would like to study for an MBA at Oxford University. Currently, tuition for the Oxford MBA is £31,000, and has been steadily rising at 5% per year. How much money money do they need to invest per month now to have enough money to pay for the MBA assuming an annual 9% investment return?" You must first calculate the FV of the price of tuition, by typing £31,000 (press "PV"), type 72 (press "n" 6 years x 12 months), and type 0.417% (press "i" 5.00% inflation rate divided by 12 months). The FV is £41,819.55. Now start the second calculation by storing the £41,819.55 (press "FV"), type 72 (press "n"), and type 0.75% (press "i" 9% investment rate divided by 12 months). Once you press "PMT" you will see that you need to invest £440.17 each month in today's pounds for 6 years to afford tuition at tomorrow's inflation adjusted price. Stayed tune for more MBA boot-camp!

Tuesday, July 28, 2009

cfa: 1. ethical & professional standards

My books arrived on Thursday, and I began studying over the weekend. The first 166 pages dealt with "Ethical and Professional Standards," which lays out the 7 Standards that all CFA charterholders and candidates must adhere to, including: Professionalism, Integrity of Capital Markets, Duties to Clients, Duties to Employer, Investment Analysis/ Recommendations/ Actions, Conflicts of Interest, and Duties to the CFA Institute. Half of the 4 Readings comprising this section also dealt with the "Global Investment Practice Standards (GIPS)," which has already been adopted by 25 countries as the standard for measuring and comparing investment performance. What surprised me most to learn, however, was that according to the CFA Topic Areas, the Ethics section had a higher percentage of test questions (15%) than every other section on the test besides "Financial Reporting & Analysis" (20%) and "Asset Valuation" (30%)!


The 8 sections that comprise GIPS include: Fundamentals of Compliance, Input Data, Calculation Methodology, Composite Construction, Disclosures, Presentation & Reporting, Real Estate, and Private Equity. A typical test question might ask you to recognize the various sections of GIPS, such as:

"With respect to the Global Investment Performance Standards, which of the following is one of the eight major sections that reflect the elements involved in presenting performance information?"
A. Real Estate.
B. Derivatives.
C. Legal and Ethical Considerations.
The answer is "A" by definition of the 8 sections that comprise GIPS.

Most of the 36 questions that followed the Ethics section would describe a potential ethical violation, and ask whether or not it was a violation, and which standard was violated:

"One of the discretionary accounts managed by Farnsworth is the Jones Corporation employee profit-sharing plan. Jones, the company president, recently asked Farnsworth to vote the shares in the profit-sharing plan in favor of the company-nominated slate of directors and against the directors sponsored by a dissident stockholder group. Farnsworth does not want to lose this account because he directs all the account's trades to a brokerage firm that provides Farnsworth with useful information about tax-free investments. Although this information is not of value in managing the Jones Corporation account, it does help in managing several other accounts. The brokerage firm providing this information also offers the lowest commissions for trades and best execution. Farnsworth investigates the director issue, concludes that management's slate is better for the long-run performance of the firm than the dissident group's slate, and votes accordingly. Farnsworth:
A. violated the Standards in voting the shares in the manner requested by Jones but not in directing trades to the brokerage firm.
B. did not violate the Standards in voting the shares in the manner requested by Jones or in directing trades to the brokerage firm.
C. violated the Standards in directing trades to the brokerage firm but not in voting the shares as requested by Jones.
D. violated the Standards in voting the shares in the manner requested by Jones and in directing trades to the brokerage firm.

The answer is "B". This may seem like a trick question at first. It is easy to lose concentration through the sheer size of the question, and the information contained. At face value it seems that Farnsworth lacks objectivity, and is not serving the best interests of his clients. More specifically, the two main issues of concern are: 1) does Farnsworth violate the standard of "Duties to Client: III(A) - Loyalty, Prudence, and Care)" by voting for the company-nominated slate of directors at the request of Jones, the company president? 2) does Farnsworth violate the same standard by directing trades to a brokerage firm to receive research reports that do not benefit the Jones Corporation? It would be easy to conclude that both of these issues would, in fact, be a violation. However, the reason why they are NOT violations is because Farnsworth came to his own independent decision after researching the issue (it just so happened that it is the same group that Jones recommended), and second, the clients benefit from the "lowest commissions for trades and best execution," so the issue of the research reports are irrelevant in this context. You can imagine a completely different answer had Farnsworth not researched the slate of directors, or if the brokerage firm had not provided the best prices and execution. The questions can be very subtle.

That wraps of Ethics, and now it's time to turn to "Quantatative Methods"! I hope to finish this section, which is 356 pages, by next week, at which point I'll post up my findings.

Thursday, July 23, 2009

waiting for CFA books

I registered for the CFA Level 1 exam on Tuesday, and I’m just now waiting for the study books to arrive. UPS tracking says that all 20lbs worth of books are making their way up from South Carolina, and should hopefully be arriving on my doorstep in New York shortly. In the meantime, I thought I would try to wrap my mind around exactly what to expect regarding the CFA curriculum, as well as the history behind the designation and why I thought it worthwhile to devote the rest of my summer to pursuing it.

The current CFA Institute traces its lineage back to the founding of the Financial Analysts Federation (FAF) in 1947. Before then, a few local societies existed for investment professionals, most notably the New York Society of Security Analysts (NYSSA), which predates the FAF by 10 years. NYSSA was founded by a group of professionals that included Benjamin Graham, the “father of securities analysis” (fundamental analysis), and acknowledged mentor of billionaire Warren Buffet.

The first actual CFA charters were not awarded until 1963, which ironically followed on the heels of great advancements in economic research out of the University of Chicago regarding financial markets, particularly with the development of the “efficient market theory (EMT).” Threatening to negate the utility of fundamental (and technical) analysis, EMT held that it was nearly impossible to beat market index returns through careful analysis of individual stocks, because all knowable information regarding the stock was instantaneously priced into them causing stocks to follow a “random walk” trading pattern. However, the success of value investors (Berkshire Hathaway) and technical investors (Renaissance Technologies hedgefund) largely refute the rigid orthodoxy of the “semi-strong” and “strong” forms of EMT.

Now that I have reassured myself that I didn’t just squander $1,100 on a designation that would be of no practical value to me, I turn to the actual content of the course. First, what does it take to become a CFA:

“In order to become a "CFA Charterholder" candidates must pass all three six-hour exams, possess a bachelor's degree (or equivalent, as assessed by the CFA institute) and have 48 months of work experience in an investment decision-making position. CFA charterholders are also obligated to adhere to a strict Code of Ethics and Standards governing their professional conduct”

Second, what are the most recent pass-rates for each level of the exam:
June 2008:    Level I: 35%     Level II: 46%     Level III: 53%

When we follow the success rate of candidates who pass through each of the 3-successive levels, then we can see that less than 9% of those who started the CFA process ultimately earn the designation. Okay now that we have established that the CFA is extremely hard, what exactly do we hope to learn, and how can this help prepare me for my Oxford MBA core-courses?

When deciding on what material will be included on the CFA exam, the CFA Institute solicits the advice of industry professionals on what the most relevant financial topics that a professional should know. The resulting “Candidate Body of Knowledge (CBOK)” is then parceled into 10 different “Topic Areas,” which are further divided into 18 “Study Sessions.” The topics are:

1. Ethics & Professional Standards 
2. Quantitative Methods 
3. Economics 
4. Financial Reporting & Analysis 
5. Corporate Finance 
6. Portfolio Management 
7. Equity Investments 
8. Fixed Income 
9. Derivatives 
10. Alternative Investments.

At first blush this might not seem too intimidating until you drill-down into "Quantitative Methods,” and realize that without the aid of a formula sheet, you will need to memorize: time value of money, probability, probability distributions and descriptive statistics, sampling and estimation, hypothesis testing, correlation analysis and regression, time series analysis, simulation analysis, and technical analysis. Whew-when I finish this my Finance I course should be a breeze!

Monday, July 20, 2009

next stop...cfa

Now that my fiancée and I have decided to book our flight to England on September 23rd (orientation begins Sept 30th and classes begin Oct 5th), I am left with roughly 2-months to finish sorting out my pre-MBA plans. You don’t have to be Gary Kasparov to know that the people who are successful in life plan several moves ahead. Of course even Kasparov can lose to IBM’s Deep Blue, so it’s always important to maintain some perspective and humility. Nevertheless it won’t stop be from trying to tip the odds for success in my favor!

First, you need balance. In a previous post I mention having joined a gym, and putting some much needed work into my tennis serve, to better prepare myself physically for the endurance challenge that is the Oxford MBA. Of course I’m also motivated by the fear I’ll be the largest person in the boat rowing for Exeter College in Oxford! Incidentally, I’ve heard from another classmate who swears that yoga is such great exercise that afterwards “you would have felt that you sweated off the equivalent of a small baby!” Regardless of which way you decide to shape-up, it's imperative to find some release for all the stress.

Second, to prepare for the coursework, I’m taking several steps, including brushing up on my personal finance by inching closer to completing my CFP® certification. With over 350,000 people claiming to be financial planners in America, only 10% have actually gone through the rigorous qualification process that I am currently going through. As a brief aside, most financial professionals in America widely agree that the following designations mark the highest of achievement in their respective fields: the CFA for financial analysts, the CFP® for personal finance, the CPA for public accounting, and the MBA for general management.

Now to become a “Certified Financial Planner” you must satisfy five principle qualifications, which are: 1) a minimum 3-years of qualifying financial planning work experience, 2) a bachelor’s degree, 3) completion of additional education requirements [typically 6 courses covering the financial planning process, insurance, investments, retirement, income tax, and estate planning], 4) an ethical background check, and 5) pass the 10-hour national Board exam. Currently, I’m waiting for my test results from the Certified Financial Planning Board. Roughly 50% of test-takers pass. I won’t know until I leave for England, however, but I’m optimistic. Nothing left to do but wait.

I believe holding both an Oxford MBA and the CFP® will help me during recruiting season. It would nicely qualify me for a job as a “private banker” on Wall Street. This would be very similar to what I do now as a financial advisor, except I would be swimming “upstream” by dealing with a wealthier clientele who face more sophisticated financial issues like how to finance their G5 private jet! Luckily, despite the recent financial market turmoil, private bankers are still very much in demand by both an aging population in the developed world, and by the increasing wealth of those in the developing world. I'm also excited to apply this background to opportunities in investment banking, private equity/venture capital, or management consulting.

Why relax!? I’m never one to slow-down, or rest on my laurels. So, now that I have the summer off and things are finally winding down, I’m looking for other ways to busy myself, and make my stay in Oxford a success! All the logistics are accounted for: my financing is in place, my accommodations confirmed, my college selected, my Visa applied for, and my post-MBA job search begun. After careful consideration, I have now decided that the best way for me to prepare for the MBA in these last 2-months is to register and study for the CFA Level 1 exam in December! Frank Sinatra has got nothing on me when he wrote "that he bit off more than he could chew" in the song "My Way."

Long considered the “gold standard” on Wall Street (besides the MBA), the “Chartered Financial Analyst” designation has come to symbolize the ultimate cerebral achievement for financial “quant jocks” around the world. In fact, studies show that individuals who hold both an MBA and CFA with 10-years experience earn an average of $250,000 per year! So, while CAPM and the Treynor ratio are still “Sharpe” in my mind from the CFP® exam, now is the perfect time to polish my HP12C financial calculator, and ready myself for the mental gymnastics needed to take-on the CFA and catapult myself ahead of the curve for such upcoming core MBA courses as Finance 1, Decision Science, and Financial Reporting. Keep checking in if you want to re-connect with your own inner quant-jock, as I will continue to post info on the CFA, as well as the Oxford MBA.