 Accepting that our resources are limited (aka factors of production: land, labor, capital, and entrepreneurship), the fundamental economic questions become: (1) what do we produce, (2) how do we produce it, and (3) how do we distribute it. Market theory, as originally developed by Adam Smith (student at Balliol College, Oxford) in his book the "Wealth of Nations (published 1776)," posits that the independent market forces of supply and demand provide the most efficient answers to these questions. That which should be produced is that for which people are willing to pay for. The method in which it should be produced is that method by which the lowest price to the consumer, and highest profit to the producer can be achieved. Further, such a product should be distributed to the highest bidder; those most willing to pay for it.
 Adam Smith, however, presupposes that all such markets for goods and services exist in an ideal state, one in which there are many buyers and sellers, no barriers to entry, perfect information, and equal and undifferentiated products where the seller is a "price-taker." This may be true in some markets, such as when you buy a loaf of bread at the supermarket, but definitely not so when you are searching for competitors to upgrade your computer's Operating System. Macroeconomics investigates this range of different markets that actually exist:
Perfect Competition --> Monopolistic Competition
--> Oligopoly --> Monopoly
As we move from left to right the producer/seller gains the upper-hand. They often enjoy large market share, barriers to entry from competitors, and a differentiated product (quality, price, and marketing) that allows the firm to "price discriminate." Many countries, including the US, are unsure about the role of monopolies. Those that have enacted Anti-Trust legislation feel that monopolies stifle innovation and suffocate new companies from emerging. Economics worry that monopolies fail to satisfy consumer demand by producing at level below equilibrium so that they can maximize profits. Others argue that this is not the case. They think monopolies offer a superior product at a lower price than consumers would otherwise enjoy. some monopolies, such as Microsoft, are quite nimble, and their size affords them the ability to spend more money on R&D leading to greater discoveries. Before we can judge which structure is best for which market we need a way to categorize each industry.
The two methods used to determine which market structure a particular industry belongs to are the "Four-Firm Concentration Ratio" and the "Herfindahl-Hirschman Index (HHI)." Both are relatively easy to calculate. In the Four-Firm approach you simply calculate the percent of market share (by sales) controlled by the four largest firms in that industry. The range spans from 0% for perfect competition to 100% for a monopoly. Anything above 60% is considered an oligopoly.

For example, if we look up ExxonMobil (XOM) stock on Yahoo!Finance we can click on "Industry," and then "Industry Summary," and discover that ExxonMobil is in the "Major Integrated Oil & Gas" industry. We can also see that the top four companies by market capitalization are: ExxonMobil ($340B), PetroChina ($214B), Royal Dutch Shell ($165B), and British Petroleum ($160B). In total, the top four companies have a market capitalization of $879B. Meanwhile, the entire industry's market capitalization is $1,305B. Therefore, the Four-Firm ratio is 67.3% ($879B / $1,305B), and the "Major Integrated Oil & Gas" industry is considered an Oligopoly.
We use the Herfindahl-Hirschman Index when we require even greater specificity. The HHI adds the square of the percentage of market share of the top 50 firms in the industry (or all the firms if less than 50). To use a different example, if there are only four firms in an industry, and their market share (by sales) are: 50%, 25%, 15%, and 10% then we would use the formula:
HHI = 502 + 252 + 152 + 102 = 3,450 (Oligopoly)
HHI = 502 + 252 + 152 + 102 = 3,450 (Oligopoly)
Where the range is:
1 (perfect competition) --> 1,000 (monopolistic competition) --> 1,800 (oligopoly) --> 10,000 (monopoly)
***It should be disclosed that I used market capitalization to calculate both the Four-Firm ratio and Herfindahl-Hirschman Index as a proxy for market share by sales since I believe that there exists a high correlation between the two statistics, and because market capitalization data is more readily available.***
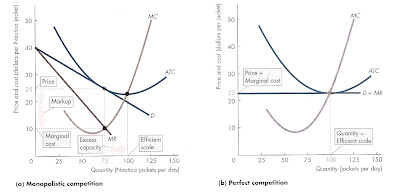
The following graphs are very useful in visually understanding the four types of market structures. The one thing they all have in common is that the equilibrium point is always found by first locating the intersection of Marginal Cost (MC) and Marginal Revenue (MR). In other words, firms always want to produce up until the point where manufacturing just one more unit no longer has any economic benefit, because the cost of producing that one additional unit outweighs the revenue generated. This will determine the equilibrium price and quantity.
Once we have found this point, we can find the equilibrium price by drawing an imaginary vertical line up to where it intersects with the Demand Curve (DC); follow the line downward to find the equilibrium quantity. Now that we know the price and quantity of that which is to be produced, we want to find out whether we are profitable. We determine profitability by once again following the imaginary vertical line that we have drawn to where it intersects with the Average Cost (AC) curve. The space between the DC and AC determines whether or not we have a profit or loss. We experience a profit if the AC lies below the DC. When AC lies above the DC we have an economic loss, and the firm should shutdown and cease operations.
Many of the examples we have used throughout this post have been oligopolies. The biggest fear when dealing with oligopolies is "price collusion," as most famously demonstrated by the oil cartel formed by OPEC during the 1970s. One way to combat oligopolies (or at least predict their behavior) is to apply game theory. When the strategies and payoffs for each player are known, and all players must follow the same rules, we can calculate the "Nash Equilibrium" for which outcome is most likely. The equilibrium depends on the nature of the game being played as there are several possible games, including the prisoners' dilemma and chicken. We expect more collusion to exist when a game is repeated, and "bad" behavior can be penalized, resulting in greater cooperation.


No comments:
Post a Comment